5.10 Identification of Outliers
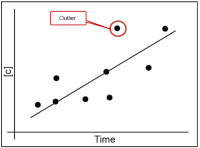
Outliers are data that appear anomalous or outside the rangeThe difference between the largest value and smallest value in a dataset (NIST/SEMATECH 2012). of expected values. Outliers may indicate errors, may indicate data unrelated to the rest of the data set, or may be perfectly valid data that indicates contamination or unusual hydrogeological conditions. In assessing chemical analyses of groundwater, it is often difficult to determine the reason for outliersValues unusually discrepant from the rest of a series of observations (Unified Guidance).. Possible reasons for outliers are recording errors, unusual sampling and laboratory procedures or conditions, or inconsistent sample turbidity. The outlier may represent an unusual hydrological condition, sampling of unrelated groundwater, or the presence of locally controlled conditions. An outlier may also be an indication of contamination. It is crucial, therefore, to carefully evaluate the possible causes for outliers.
This section presents useful tests to identify outliers; unfortunately, identifying outliers in environmental contexts is not an exact science and there is no list of clear rules to follow in identifying outliers. The goal of outlier identification is to properly analyze the data to determine which outliers are representative of valid data points (and should be kept), and which outliers likely represent errors, and should be removed from the data set. Data should not be excluded simply because they are identified as outliers. Once you have been identified outliers should be further evaluated to determine the reason for their existence. Outliers should generally be kept as part of the data set unless there is reasonable evidence that they are the result of an error. Many statistical tests require that outliers resulting from error be removed; some statistical tests may also require removal of valid, but extreme outliers that are not representative of the general population. The presence of outliers may preclude the use of some statistical methods altogether, requiring for example, a nonparametricStatistical test that does not depend on knowledge of the distribution of the sampled population (Unified Guidance). alternative.
Box plots and probability plots are good tools for screening the data to identify possible outliers. Dixon's test may be used to evaluate a single suspected outlier. If multiple outliers are suspected, each outlier should be tested individually, beginning with the least extreme and progressing to each of the next extreme values until an outlier is confirmed. At that point, all values that are more extreme are also confirmed as outliers. Data sets with more than 20 values can be tested for multiple outliers using Rosner's test. Dixon’s and Rosner’s tests are more formal outlier tests involving the computation of a statistic that is compared to tabulated critical values.
As with all statistical procedures, data sets with many nondetectsLaboratory analytical result known only to be below the method detection limit (MDL), or reporting limit (RL); see "censored data" (Unified Guidance). require care in applying outlier tests and in evaluating the practical implications of performing the tests on detects only or on data which include nondetects. In all cases, if nondetects are present in a data set, the results of outlier testing should be carefully examined to ensure validity from both a practical standpoint and a numerical basis.
5.10.1 Box plots or box and whisker plots
Box plots can be used as an initial screening tool for outliers as they provide a graphical depiction of data distribution and extreme values. Some software can also be programmed to display as outliers data values that exceed a specified distance from the measure of central tendency (meanThe arithmetic average of a sample set that estimates the middle of a statistical distribution (Unified Guidance). or medianThe 50th percentile of an ordered set of samples (Unified Guidance).). See Section 5.1.2: Box Plots of this document for more detail. Chapter 12.2, Unified Guidance provides a discussion on screening for outliers using box plots.
5.10.2 Probability plots
Probability plots are used for graphically displaying a data set’s conformance to a normal distributionSymmetric distribution of data (bell-shaped curve), the most common distribution assumption in statistical analysis (Unified Guidance)., and can be used as a screening tool for the initial identification of outliers. See Section 5.1.5: Probability Plots for more detail. A brief description of screening for outliers using probability plotsGraphical presentation of quantiles or z-scores plotted on the y-axis and, for example, concentration measurement in increasing magnitude plotted on the x-axis. A typical exploratory data analysis tool to identify departures from normality, outliers and skewness (Unified Guidance). is provided in Chapter 12.1, Unified Guidance.
5.10.3 Dixon’s test
Dixon’s test for single high or low outliers is relatively easy to perform and is offered in many statistical software packages. Generally, the data are ordered from lowest to highest, and the test computes a ratio between two values: the difference between the suspected outlier and a population value “near” the potential outlier, compared to the range of sample values in the population. The value of this ratio, (the test statistic), is then compared to a tabulated critical value that is based on the sample size and desired confidence levelDegree of confidence associated with a statistical estimate or test, denoted as (1 – alpha) (Unified Guidance).; if the test statistic is greater than the critical value, the suspected outlier is confirmed as a statistical outlier.
Dixon’s test evaluates a single suspected outlier. If you suspect more than one outlier, test these outliers individually, beginning with the least extreme and progressing to each of the next extreme values until an outlier is confirmed; at that point all values that are more extreme are also confirmed as outliers. Data sets with more than 20 values can be tested for multiple outliers using Rosner’s test.
This test is a formal statistical test to identify outliers; it is most useful for small (n ≤ 25) data sets with a single suspected outlier.
Only one outlier is present.
- Data are normally-distributed (when suspected outlier removed).
- Number of sample values is < 25.
- The test is simple to implement and you can perform calculations by hand.
- This test can be used with small data sets.
- This test is widely available in statistical software packages.
Additional information regarding the application of Dixon's test is provided in Chapter 8.3 and Chapter 12.3, Unified Guidance. Chapter 12.3, Unified Guidance includes a sample problem.
5.10.4 Rosner’s test
Rosner’s test helps to identify multiple outliers in a data set with at least 20 normally-distributed values. To use this test, you must first determine the number of potential outliers or extreme values present. This number of extreme values is then tested as a group and if the test is significant, all are determined to be outliers. If the test is not significant, the least extreme value of the group is removed and the reduced group is evaluated again. The process continues until either a significant result is obtained or the entire group is eliminated from outlier status.
Since Rosner’s method tests a group of suspected outliers, a significant result can be returned even though not all of the data values in the group are individual outliers. Thus it is particularly important to pre-screen the data (visually or graphically) to make the selection of potential outliers as accurate as possible prior to running Rosner’s test. However, this test may identify multiple outliers in a single pass, unlike Dixon’s test, which must be performed iteratively to screen for multiple outliers.
A formal statistical test to define outliers; useful for multiple suspected outliers in moderate to large data sets.
- Data are normally-distributed (when suspected outliers are removed).
- Required sample size is at least 20.
The data follow a normal distribution (or can be normalized) and the outliers come from a different distribution.
- You must determine which points are potential outliers before conducting the test.
- This test is good for larger data sets.
- This test is not as simple to perform as Dixon's test for a single outlier.
- This test is widely available in statistical software packages.
A description of how to conduct Rosner’s test is found in Chapter 8.3 and Chapter 12.4, Unified Guidance. A sample problem is also provided in Chapter 12.4, Unified Guidance.
Publication Date: December 2013